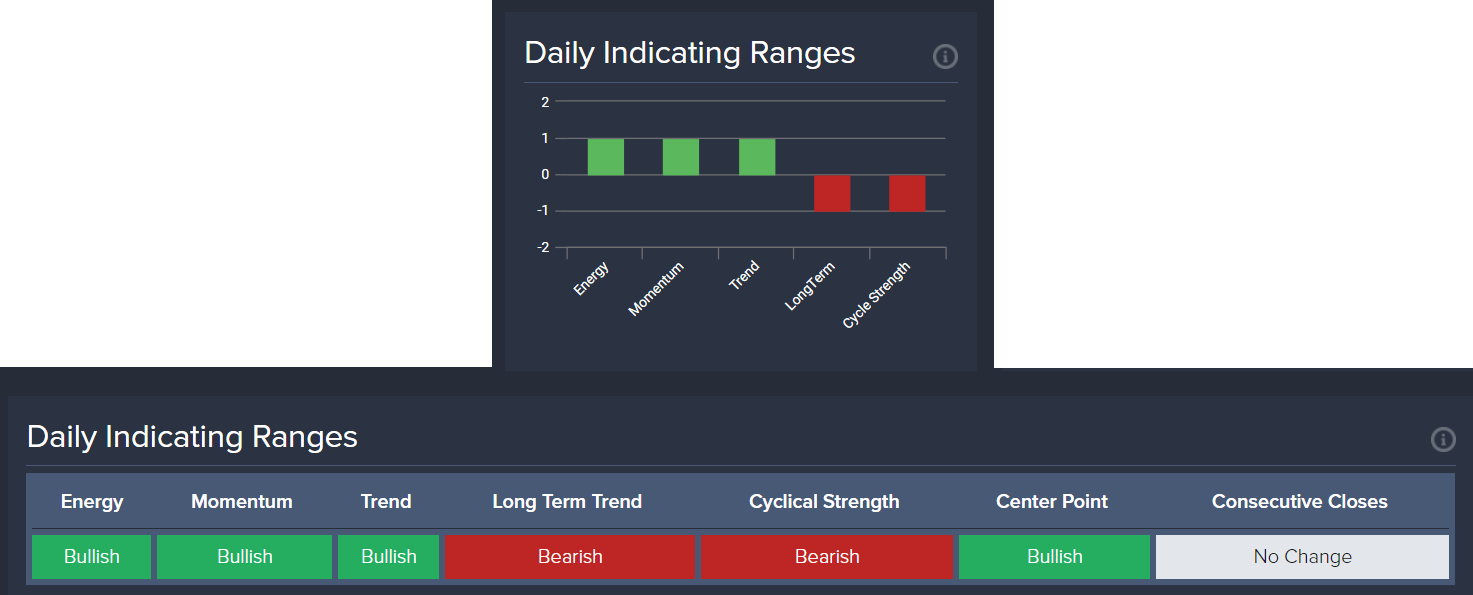
Indicating Ranges
The Indicating Ranges are shown in the market data table for each covered market:

And on the Pro Members Premium Tools Dashboard:

Indicating Ranges is a collection of proprietary computer models that assess data for both time and price considerations on a closing basis for each covered market. These computer models systematically assess the relative strength or weakness of technical and cyclical market conditions using different studies:
- MomentumThe market's ability to move quickly in either direction.—Indication of the possibility of a relative near‑term price movement based on assessment of buying vs. selling in relation to the current trend.
- Trend—Indication of the current market trend over a relative short period of time (one to two units of time).
- Long-Term—Indication of the current market trend over a relative longer period of time (y‑number of time units). A shift on this indicator implies the possibility for a sustained change in the market trend.
- Cycle StrengthIndicates the strength of time-related trends. This indicator tends to pick highs and lows in extremely volatile moves.—Indication of the possibility of a relatively major price move (bullish or bearish), measured from the last major high or low. This study incorporates the fixed timing elements of the Empirical model found in the Arrays and tends to identify highs and lows in extremely volatile moves.
Following the close of a time unitThe time level being considered: days, weeks, months, quarters, or years., the Indicating Ranges update with a standardized point‑in‑time assessment of market condition as either bearish (negative), neutral or bullish (positive).
- Once an assessment is generated by the computer model, the Indicating Range will not update again until the then-current time unit closes.
- Dailies update after the close of every trading session, but weekly only updates once per week after the close. Similarly, monthly only updates once a month, and so on.
- By comparison, this is different from the GMWGMW. One of four core Socrates Platform models. This pattern recognition model provides an objective computer analysis of all covered markets based on technical price movement, to provide a visual of what is unfolding on a global basis., which systematically generates a color/comment after every day’s trading session for all time levelsOne of the five key viewpoints of time into which analysis is divided: daily, weekly, monthly, quarterly, and yearly. Also called a time frame.. This happens on a rolling basis, so the colors/comments may change the time unit progresses towards its close (a week, a month, and so on).
Colors indicate the market trend:
- Red—Bearish.
- Gray—Neutral.
- Green—Bullish.