Arrays
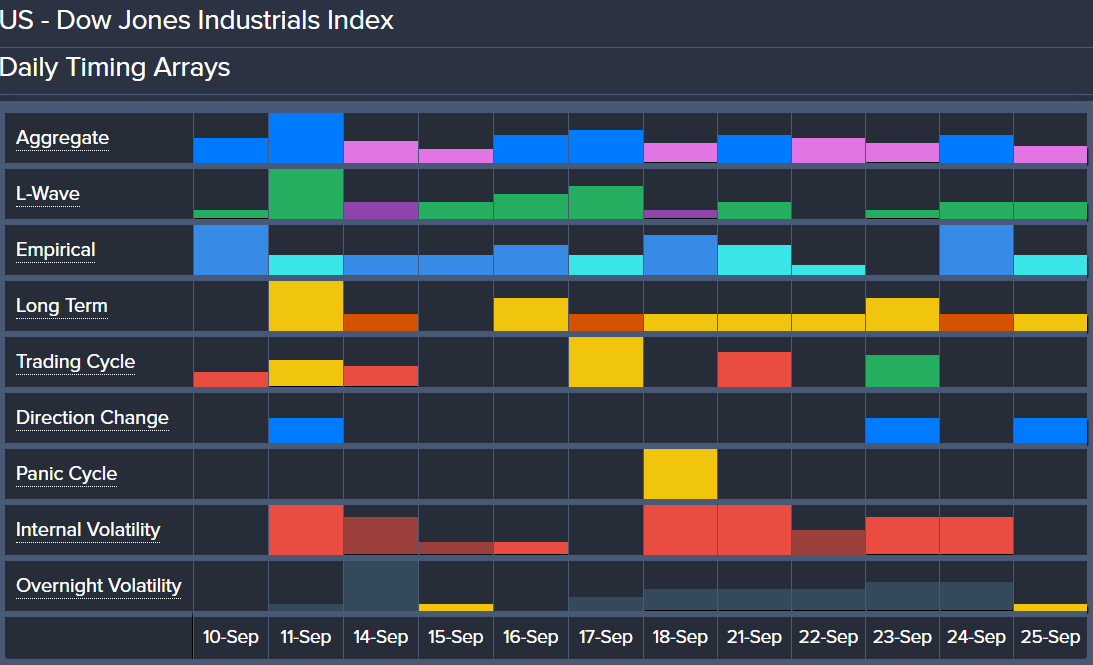
Dozens of computer models analyze when market cycles may come due at a given time. The arrayOne of four core Socrates Platform models. Arrays is collection of time-based models presented in a graphical overview to help identify potential highs, lows, and important changes in trend and volatility for a given time level. table displays a select number of key models. Each model is designed to assess possible convergences of time and cyclical activity from a different perspective. The objective is to help identify possible synergy of cyclical activity across different models within a given time unitThe time level being considered: days, weeks, months, quarters, or years..

- The Aggregate row is a summation of all the models and the recommended focal point when studying the arrays.
- Each row represents a different model.
- Each column represents a unit of time, with the table showing a total of 12 units of time.
- When the same color bar follows a bar in a row, it represents the same size or a continuance in the increase or decrease of the bar size, with the exception of the Trading CycleTaken from the Greek word “kyklos” meaning circle or returning to the point of origin. A rhythm or frequency of repetitive nature as in weather or in regular oscillations from peak to trough in a time series. row.
- When a different color bar follows a bar in a row, it represents the opposite movement of the preceding bar, with the exception of the Trading Cycle row.
- The closer the time unit, the more cycle data analyzed.
Arrays are available to Pro level members with premium market subscriptions and are shown in your Pro Member Grid and on the Arrays tab in the Pro member premium tools.
Importance
High Aggregate bars aligned with spikes in other rows can signal the possible timing of when market turning pointsA point in time at which a market direction change occurs or may occur. Also called a target date., changes in trend, or volatility may occur.