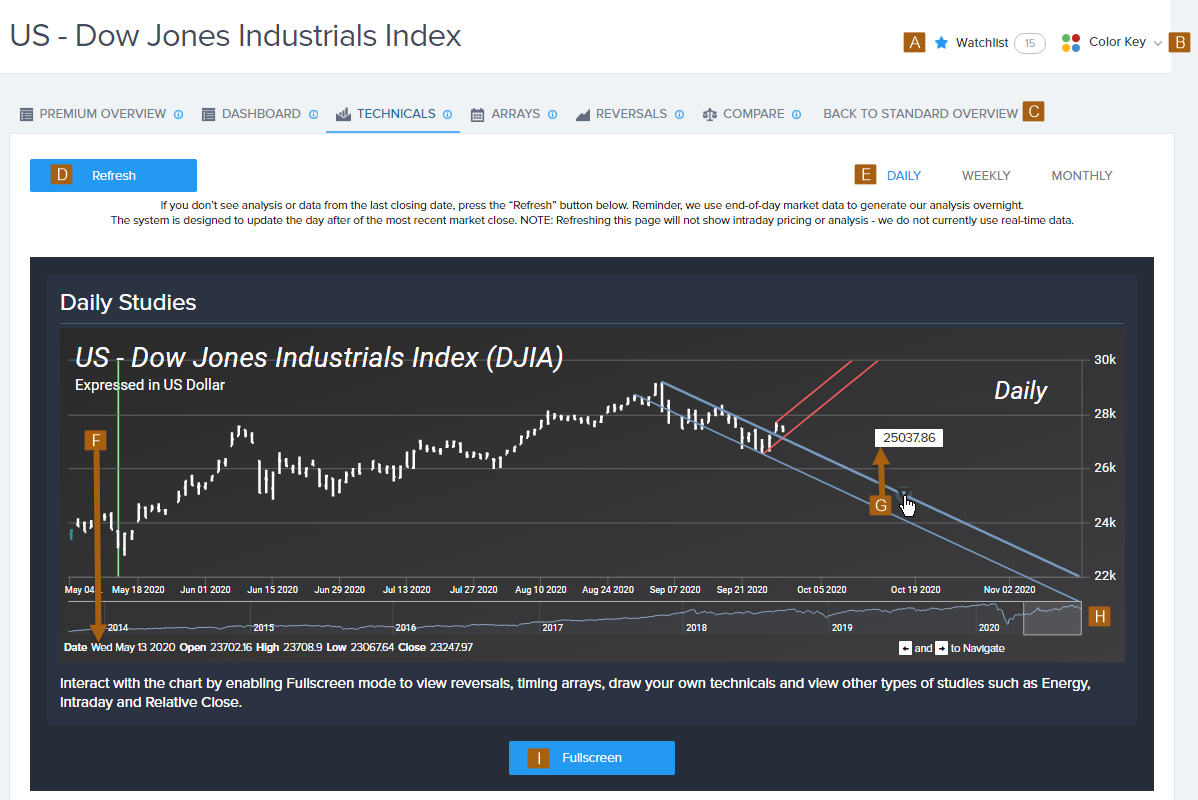
View Technicals (Chart Studies) for a Market
The technicals chart for a covered market is available to Pro members.
This is a price history chart that allows you to analyze statistical trends in market activity.
In the Pro Member Premium Tools, select the Technicals tab to see the technicals chart for the selected market.

- Show your watchlist.
- Show the GMW color key.
- Return to the Pro Member Grid View.
- Refresh the information on the screen.
- Change the time levelOne of the five key viewpoints of time into which analysis is divided: daily, weekly, monthly, quarterly, and yearly. Also called a time frame..
- On your keyboard, use the arrow keys to move the line across the chart to see price information below.
- Hover over a line to see its value at a specific point in time.
- Drag the time marker to see a different date range on the chart.
- Show a full‑screen chart of the price information with a full set of chart tools.