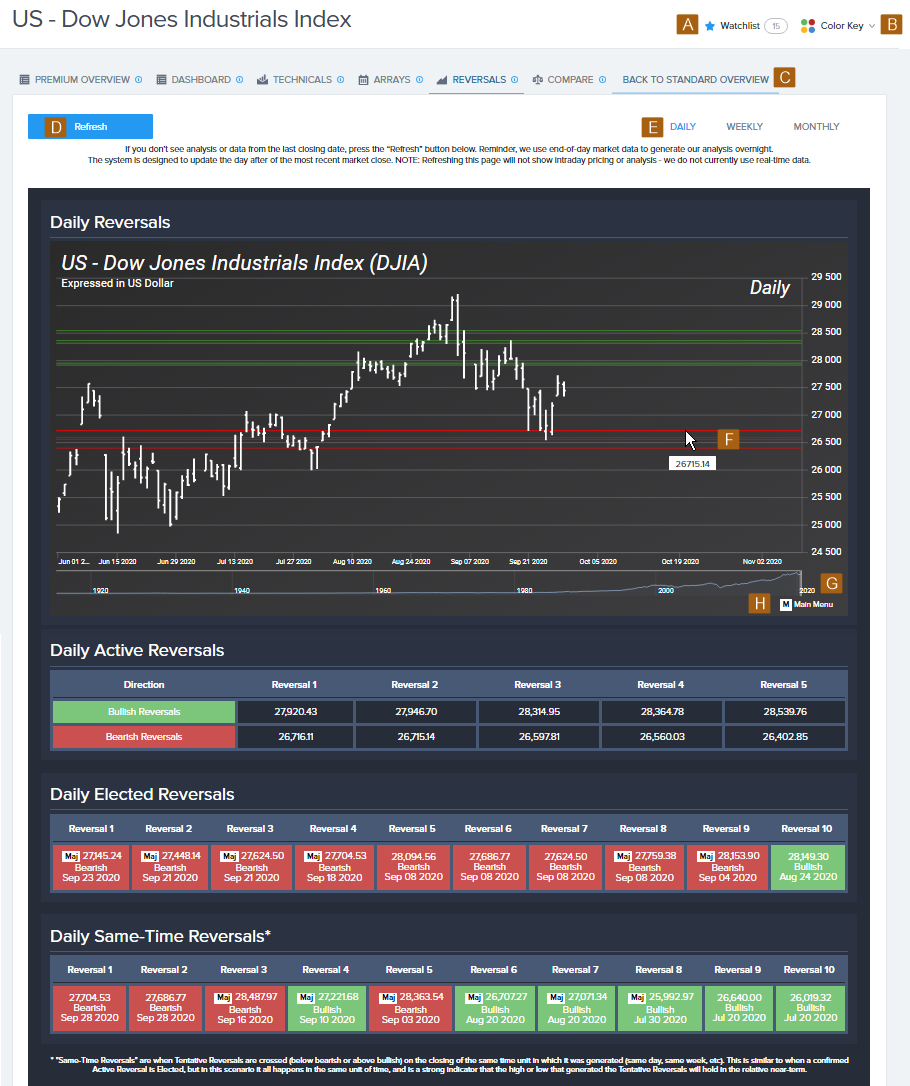
View Reversals for a Market
Reversals for a covered market are available to Pro members.
In the Pro Member Premium Tools, select the ReversalsOne of four Socrates Platform core models. The Reversal System is a computer model based on the theory that specific pressure points (the reversal points) exist within price movement. tab to see a reversals chart and tables for the selected market.

- Show your watchlist.
- Show the GMW color key.
- Return to the Pro Member Grid View.
- Refresh the information on the page.
- Change the time levelOne of the five key viewpoints of time into which analysis is divided: daily, weekly, monthly, quarterly, and yearly. Also called a time frame..
- Hover over a line to see its value at a specific point in time.
- Drag the time marker to see a different date range.
- Press M on your keyboard to show a full set of chart tools.
Reversal Points Displayed on the Reversals Tab
The active reversal pointsReversal points are generated each time a market produces a new isolated high or low on an intraday basis. that display in the chart and active reversal table (and in the Pro Member Grid View) are those nearest to the current price levels of the covered market. These are not necessarily all active reversals that exist at that time.
We use a statistical moving average of price movement and volatility for each covered market to identify the range of then‑current price activity for each time level. The active reversal points, both bullish and bearish, that fall within that range are displayed.
This results in certain reversal points not showing on the Reversals tab or elsewhere at different times, but it doesn't mean they no longer exist. When price movement shifts, reversal points within the then‑current range will display.
This approach helps to keep focus on the reversals that are most relevant at a given point in time.
Keep in mind, you may see a larger list of reversals referenced within the Premium analysis text, which is by design and for your reference.