Economic Confidence Model (ECM)
ECMECM. One of four core Socrates Platform models. This is the base model for comprehending the global economy that focuses on the flow and concentration of capital around the world as a means to identify shifts in confidence that may lead to major economic events. is a computer model that analyzes the global economy by tracking capital flows and concentration, providing a macro long-term perspective of when shifts in confidence are possible that could lead to notable economic events as demonstrated over the course of history.

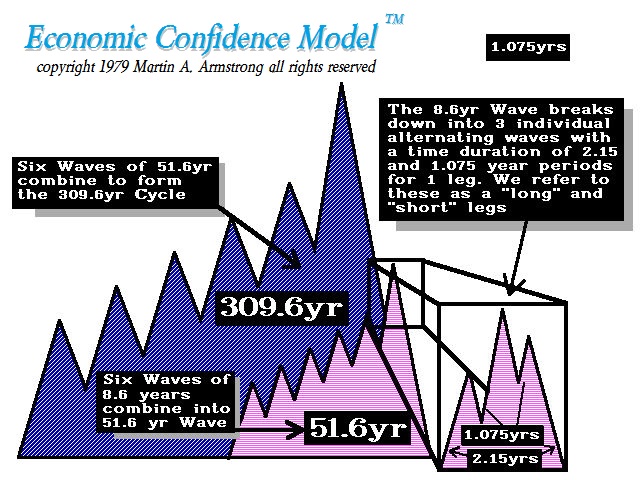
- The model consists of cycleTaken from the Greek word “kyklos” meaning circle or returning to the point of origin. A rhythm or frequency of repetitive nature as in weather or in regular oscillations from peak to trough in a time series. waves that vary in length, from shorter to longer, and build up over time; for example, 8.6 to 51.6 to 309.6 years.
- It examines these cycle waves to discover when they are set to culminate, reflecting a possible shift in market confidence at that point in time.
- This shift in confidence is reflected by capital flows and concentration.
- The longer the cycle waveA single oscillation measured from one peak to the next or from one trough to the next., the greater the magnitude of the shift in confidence.
- The dates in the model that reflect possible shifts are referred to as ECM turning pointsA point in time at which a market direction change occurs or may occur. Also called a target date..
The ECM does not track or forecast individual financial instruments, securities, or markets.
The ECM is shown at the bottom of your Homepage.
Importance

Capital tends to concentrate into a single nation or region, and then into a single sector or asset class in that region.
- When a majority of investors feel confident and invest in one sector or nation, it eventually leads to overvaluation and an overconcentration of capital, which can lead to a bubble and then to financial panics relative to the time and circumstances.
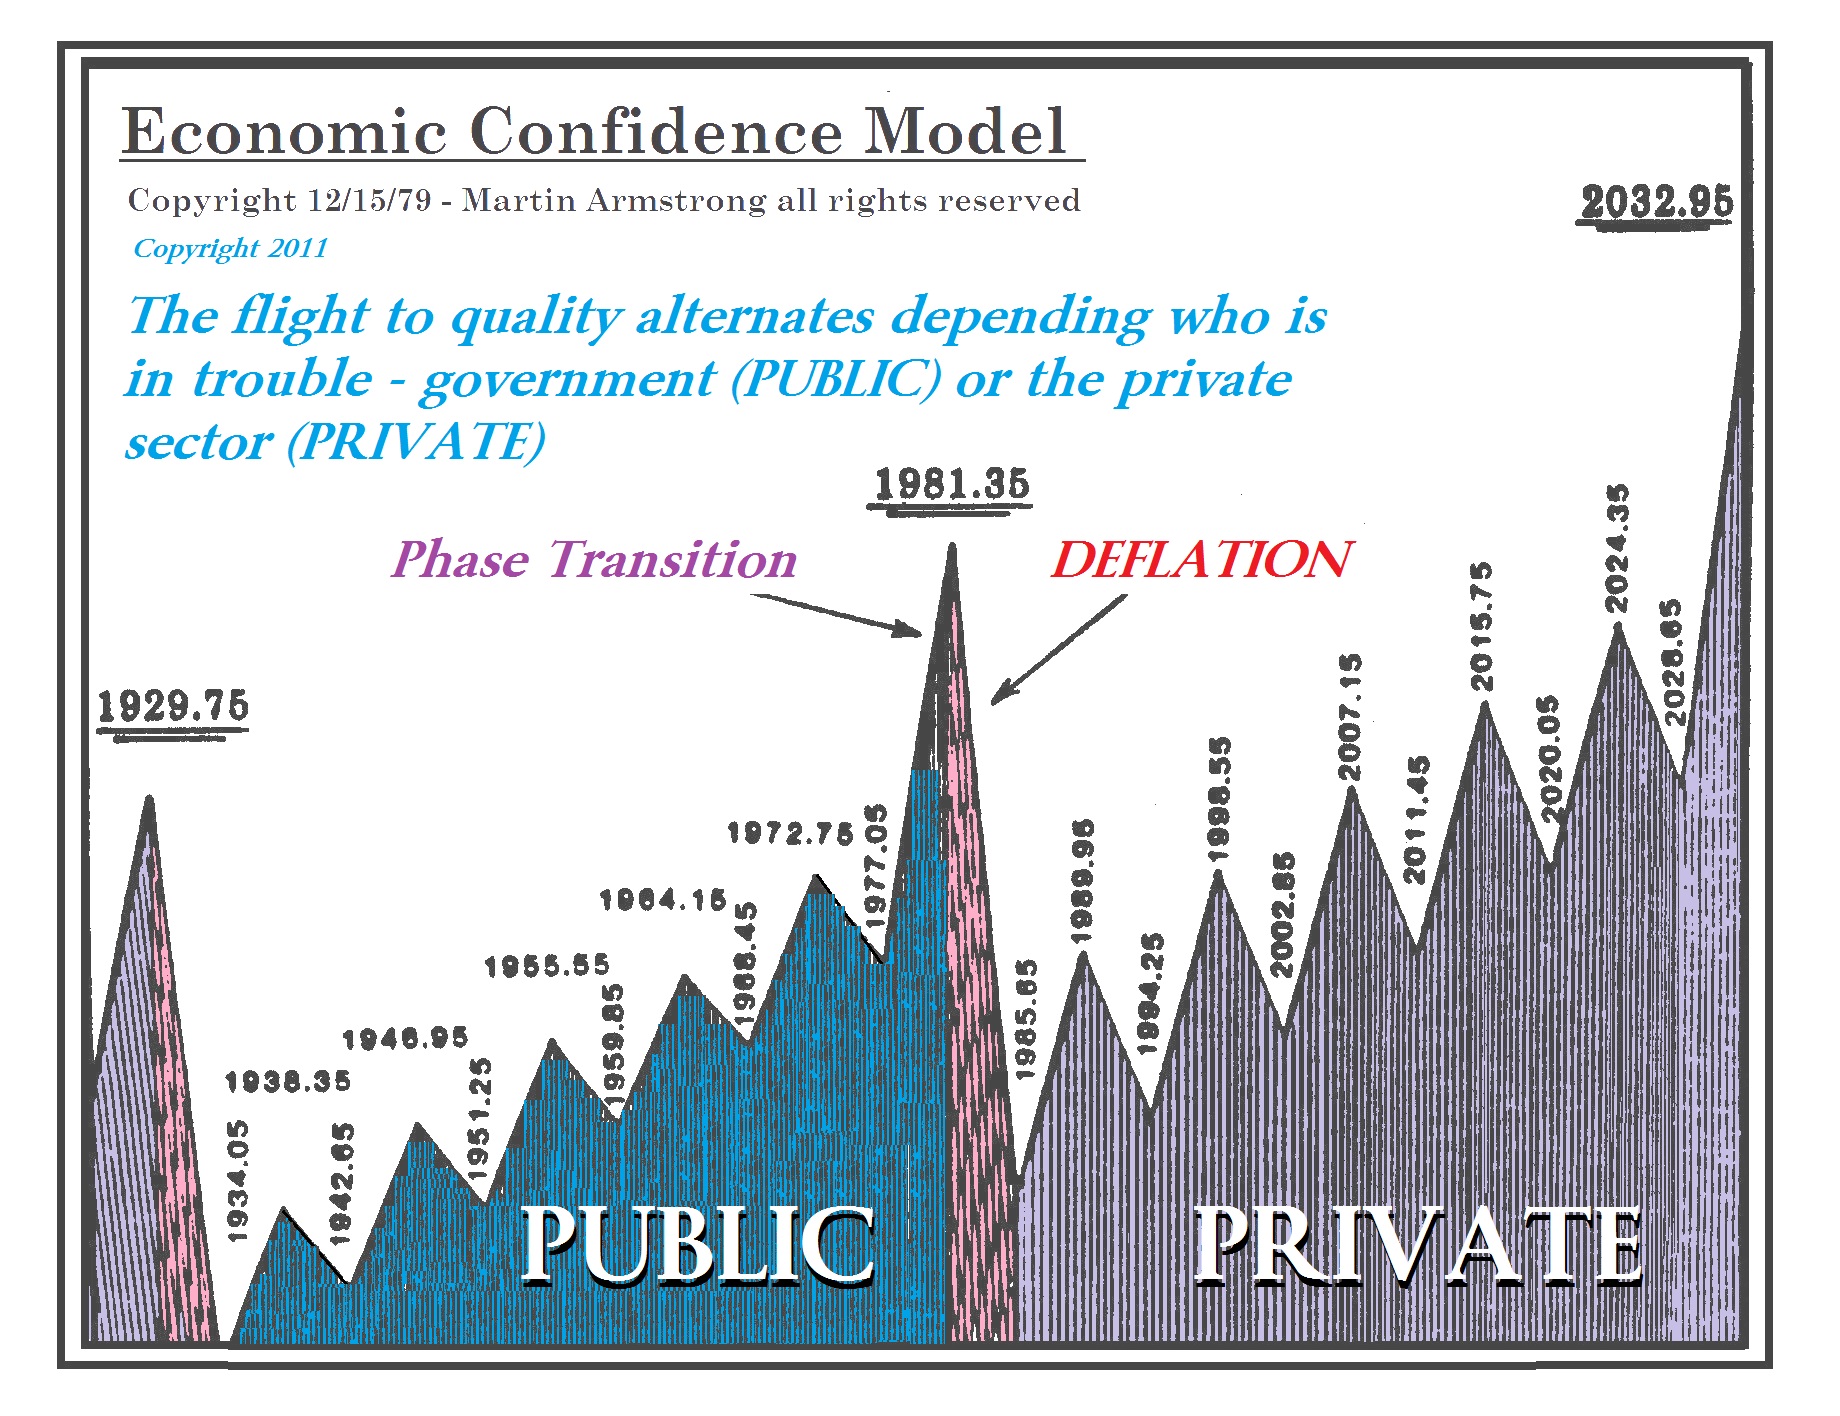
- In the example above, capital moved back and forth from public (government bonds) to private sector (stocks) every sixth wave (51.6 years).
- Confidence peaksThe high; the highest point within a time series. by the end of the last wave in a 51.6-year period, followed by a pivot downward in confidence by the end of the first wave in the next 51.6-year period.
If a covered market has a turning point in the arrays that aligns with an ECM target dateA point in time at which a market direction change occurs or may occur. Also called a turning point., the turning point has a greater likelihood to come to fruition.