View Capital Flows Map
Your Homepage shows a Global Capital Flows Heat Map that shows a high-level picture of the most recent or projected flow of global capital.
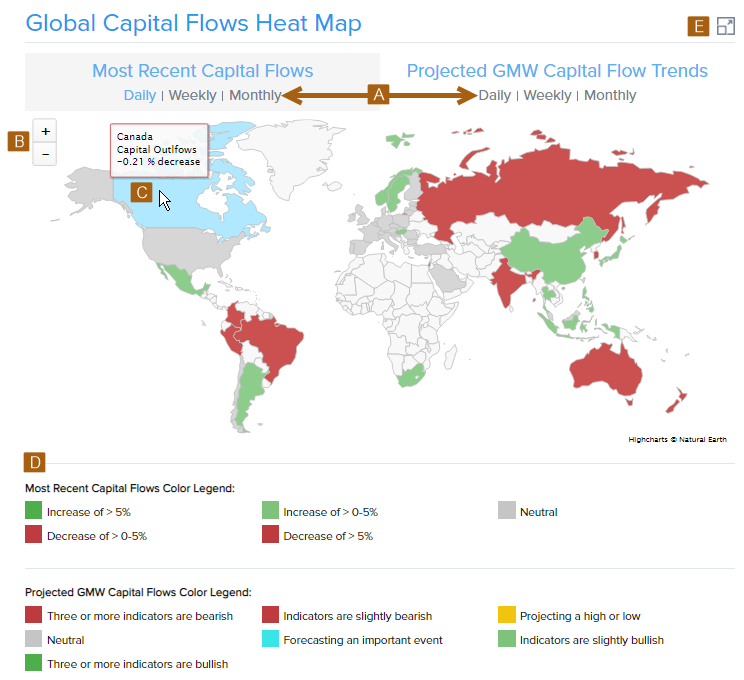
- Select Daily, Weekly, or Monthly to show the flow of capital across the selected time levelOne of the five key viewpoints of time into which analysis is divided: daily, weekly, monthly, quarterly, and yearly. Also called a time frame. for either the most recent or projected flow.
- To change your focus within the map, select Zoom In (+) or Zoom Out (-), roll your mouse wheel, or use pinch-in or pinch-out gestures on your track pad or screen. When zoomed in, select and drag the map to change the area of focus.
- Hover over a country to see details for the country.
- The legend explains the map color coding.
- Select Expand to see larger view of the most recent and projected flow maps.